
When you first begin working on the bench, performing quality control (QC) may seem like a daunting task. You will learn the basic definition of QC in class, as well as the rules that determine if QC results are “in” (acceptable) or “out” (unacceptable). You may look at Levey-Jennings charts until your head spins. But, for me at least, running and troubleshooting QC did not make a whole lot of sense until I began working the bench.
Once I began working with the same instruments, reagents, and QC material day in and day out, I developed a much deeper understanding of not only running QC, but what to do when QC runs go wrong. So, in this post I will show you my thought process as I work through QC troubles. I will be highlighting some common Westgard Rule violations, but this is by no means an exhaustive list.
12s Westgard Rule Violation
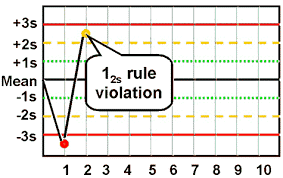
A 12s violation means that your QC result is either 2SD (Standard Deviations) above or below the established mean. If you see this flag on your result, congratulations! This is actually just a warning flag and does not mean that your result should be rejected…as long as this is an isolated event. When interpreting the Levey-Jennings chart, especially in this case, I find it helpful to keep a traditional bell curve in mind. So let me show you our 12s result another way:
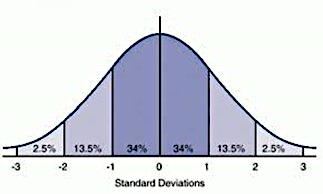
As you can see, the area between ±2SD and ±3SD make up 5% of the distribution. So what does that mean for laboratory scientists performing one or more runs of QC, on many analytes, over the course of many days? Statistically, 1 in 20 of these results are going to be above or below that 2SD cutoff, for no particular reason. And that is why we just let this result off with a warning.
22s Westgard Rule Violation
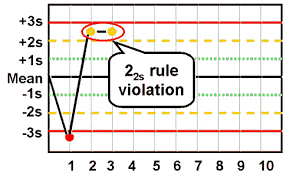
As a side note, 22s applies to the same control level being out 2SD on two consecutive runs, OR both levels of controls being out 2SD. Unfortunately, 22s is where the warnings end and corrective action begins.
Going back to the statistics, a random result in the 5% of the ±2SD distribution is understandable. However, the odds of having a second result fall in that distribution for no reason other than random chance is 1 in 400. So now we need to see if we can figure out the source of this error, which we will begin covering in the next section.
13s Westgard Rule Violation
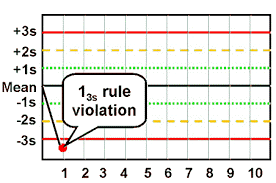
There it is: the result no laboratory professional wants to see! The cause of so many woes and breakage of trust between tech and analyzer. Unfortunately, it will happen, it does happen, and now we have to deal with it. Again, going back to the bell curve, our chances of getting a random result outside of 3SD are around 0.3%. We don’t want to bet the accuracy of our patient results on those odds, so it’s time to figure out what’s going on.
First of all, this is when I take a break from staring at all of these charts. I look at the numerical data for my QC result. Is my result out by 0.01mg/dL or some other frustratingly small amount? If so, this is usually when I curse the QC gods for their rounding errors and then just do a plain rerun. By that, I mean using the same QC material (with a fresh aliquot if applicable) and the same reagent. I document this corrective action so that my senior tech knows exactly what I did (and I hopefully save them a headache during QC review). If this works, great! If not, we continue.
Next, it’s time to examine the QC material. Thawing, reconstituting, mixing, refrigerating, time left out at room temperature, and the inherent stability of the QC are all factors that may produce erroneous results. So now I will prepare fresh QC material, taking extra care to follow the manufacturer’s recommendations to ensure I have the best chance at success. If this corrects my result, I will document that. If not, it’s onto reagents.
First, I will take into consideration the reagent stability along with its open date. Maybe my QC is out on an analyte that we don’t test for frequently and the reagent kit is low. This still requires corrective action, but at least I can chalk it up to an old reagent and I’m not wasting a lot of supplies disposing of it.
Next, I will look at the QC charts from the last couple of days on all levels. A trend in QC seen on one or multiple levels usually signifies to me that the reagent (or possibly calibration) is going bad. What about a shift? Have we recently done a calibration or changed lots?
Taking these factors into consideration, I might get out a fresh reagent pack and repeat my QC again. However, it is important to understand the implications of this action. If you performed patient testing with a reagent that is failing QC, those patient results may not be accurate. Depending on the laboratory, either the person performing the QC or a lead tech/manager should investigate this further. Either way, this should be documented in your QC corrective action, and it would also be a good idea to communicate this to management directly.
Suppose you’ve repeated, changed QC material and repeated, and changed reagent and repeated yet again. And your QC result is still out! At this point, if feasible, patient testing for that specific analyte should be discontinued. This is now possibly an issue with calibration, the lot/shipment of reagents, or the instrument itself. This is now when you should involve the senior tech/supervisor over that analyzer so they can help you decide how to proceed.
While getting into this situation may be frustrating, what’s important is that you have prevented a faulty instrument or reagent from impacting patient results. That is what quality control is all about!
May the QC gods smile upon you!